Plot histogram
See also
Other plotters:
plot_corr_heatmap(),
plot_expr_heatmap(),
plot_pca(),
plot_read_depth(),
print_or_save_plot()
Other moo methods:
batch_correct_counts(),
clean_raw_counts(),
diff_counts(),
filter_counts(),
filter_diff(),
normalize_counts(),
plot_corr_heatmap(),
plot_expr_heatmap(),
plot_pca(),
plot_read_depth(),
run_deseq2(),
set_color_pal()
Examples
# plot histogram for a counts slot in a multiOmicDataset Object
moo <- multiOmicDataSet(
sample_metadata = nidap_sample_metadata,
anno_dat = data.frame(),
counts_lst = list("raw" = nidap_raw_counts)
)
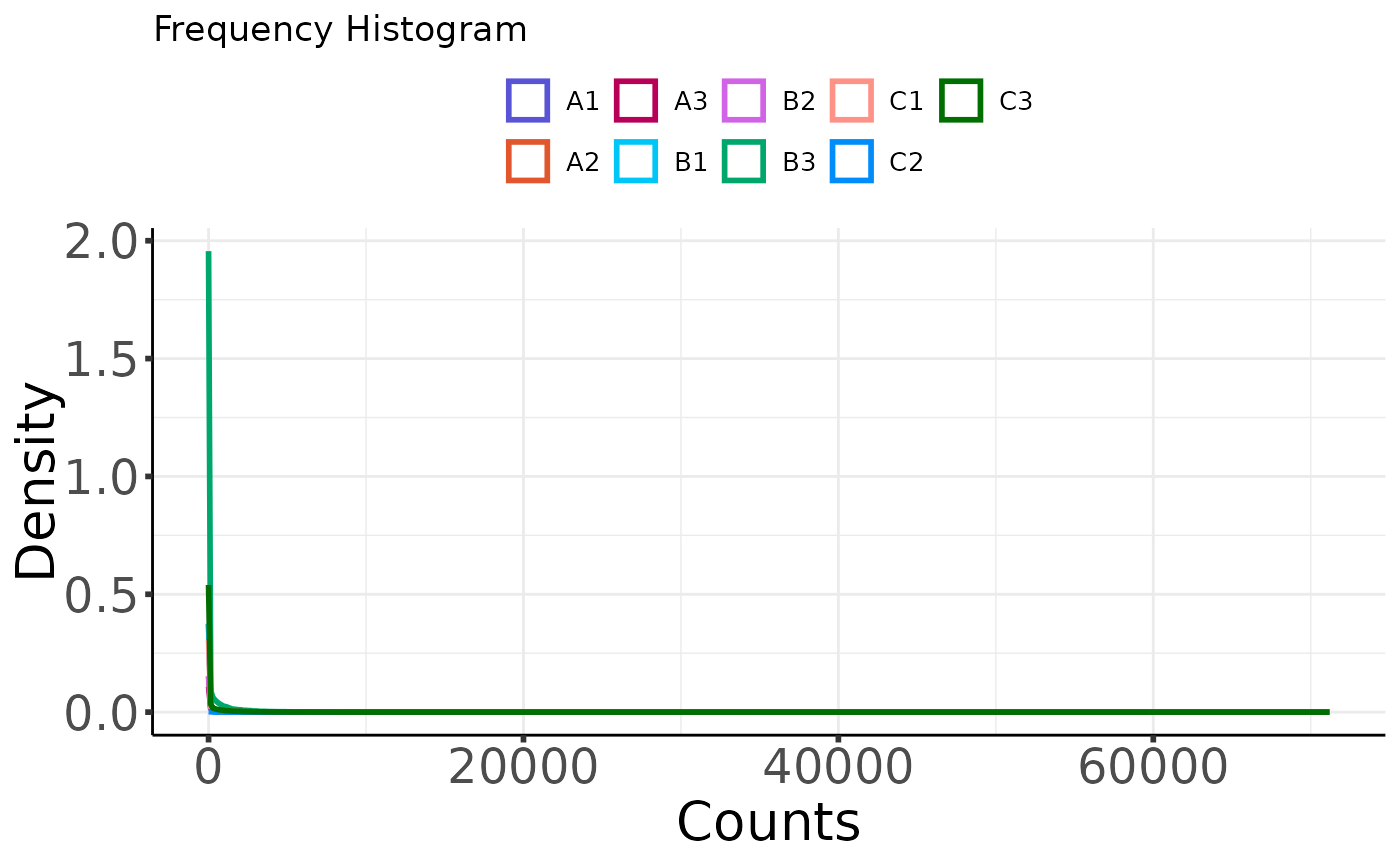
p <- plot_histogram(moo, count_type = "raw")
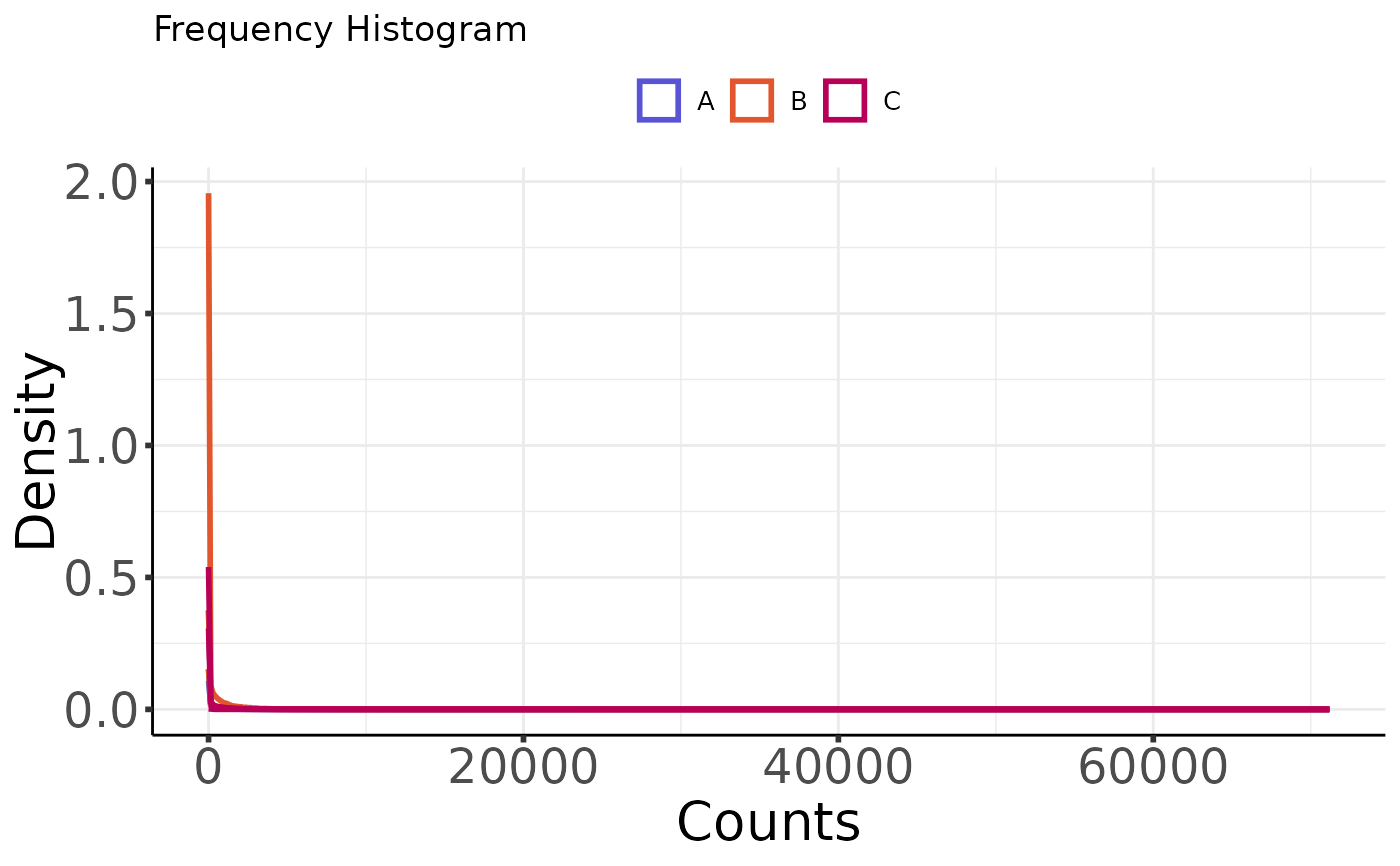
# customize the plot
plot_histogram(moo,
count_type = "raw",
group_colname = "Group", color_by_group = TRUE
)
 # plot histogram for a counts dataframe directly
counts_dat <- moo@counts$raw
plot_histogram(
counts_dat,
sample_metadata = nidap_sample_metadata,
sample_id_colname = "Sample",
feature_id_colname = "GeneName",
label_colname = "Label"
)
# plot histogram for a counts dataframe directly
counts_dat <- moo@counts$raw
plot_histogram(
counts_dat,
sample_metadata = nidap_sample_metadata,
sample_id_colname = "Sample",
feature_id_colname = "GeneName",
label_colname = "Label"
)