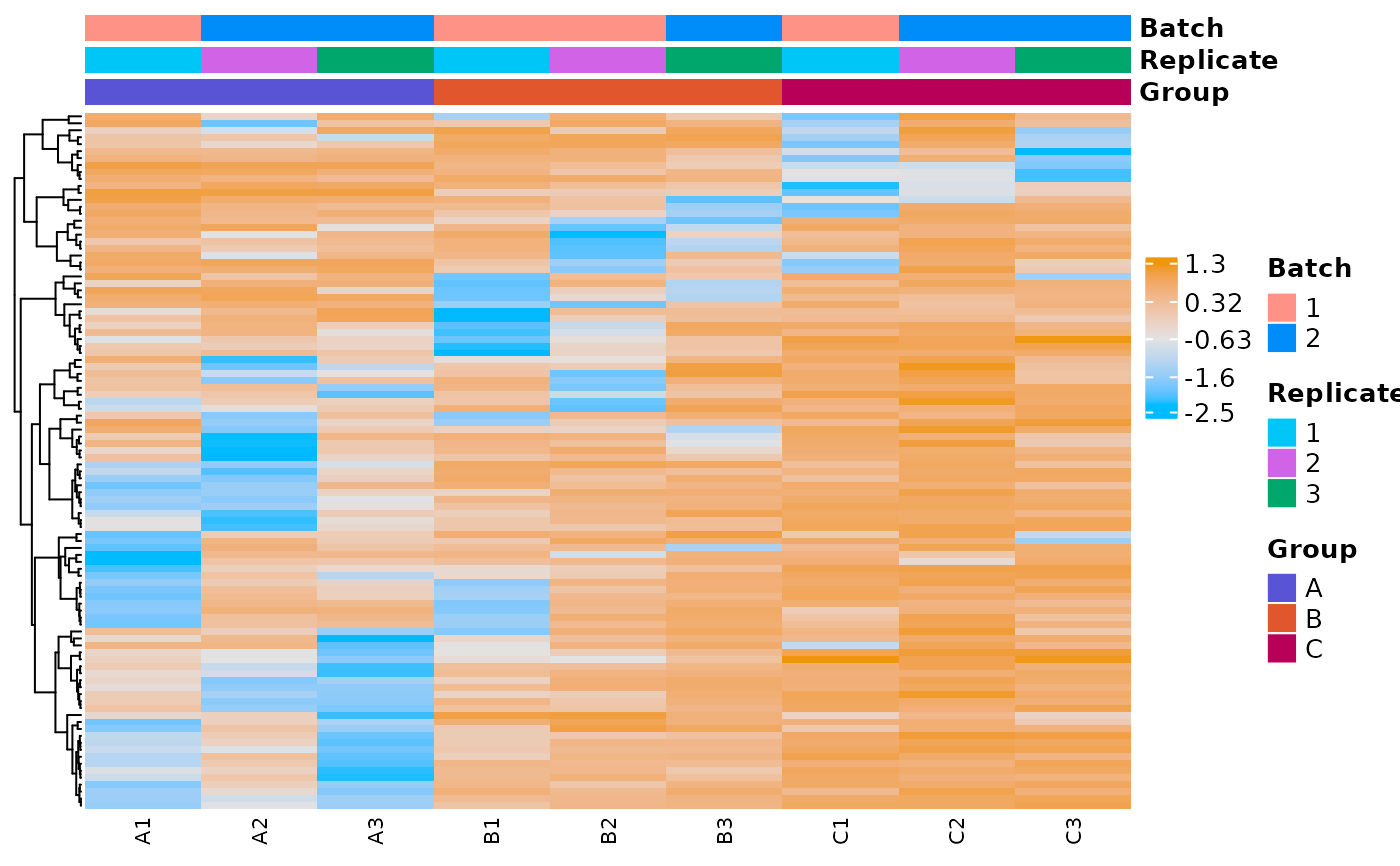
The samples (i.e. the columns) are clustered in an unsupervised fashion based on how similar their expression profiles are across the included genes. This can help identify samples that are non clustering with their group as you might expect based on the experimental design.
Usage
plot_expr_heatmap(
  moo_counts,
  count_type,
  sub_count_type = NULL,
  sample_metadata = NULL,
  sample_id_colname = NULL,
  feature_id_colname = NULL,
  group_colname = "Group",
  label_colname = NULL,
  samples_to_include = NULL,
  color_values = NULL,
  include_all_genes = FALSE,
  filter_top_genes_by_variance = TRUE,
  top_genes_by_variance_to_include = 500,
  specific_genes_to_include_in_heatmap = "None",
  cluster_genes = TRUE,
  gene_distance_metric = "correlation",
  gene_clustering_method = "average",
  display_gene_dendrograms = TRUE,
  display_gene_names = FALSE,
  center_and_rescale_expression = TRUE,
  cluster_samples = FALSE,
  arrange_sample_columns = TRUE,
  order_by_gene_expression = FALSE,
  gene_to_order_columns = " ",
  gene_expression_order = "low_to_high",
  smpl_distance_metric = "correlation",
  smpl_clustering_method = "average",
  display_smpl_dendrograms = TRUE,
  reorder_dendrogram = FALSE,
  reorder_dendrogram_order = c(),
  display_sample_names = TRUE,
  group_columns = c("Group", "Replicate", "Batch"),
  assign_group_colors = FALSE,
  assign_color_to_sample_groups = c(),
  heatmap_color_scheme = "Default",
  autoscale_heatmap_color = TRUE,
  set_min_heatmap_color = -2,
  set_max_heatmap_color = 2,
  aspect_ratio = "Auto",
  legend_font_size = 10,
  gene_name_font_size = 4,
  sample_name_font_size = 8,
  display_numbers = FALSE,
  plot_filename = "expr_heatmap.png",
  print_plots = options::opt("print_plots"),
  save_plots = options::opt("save_plots"),
  plots_subdir = "heatmap",
  ...
)

## S7 method for class <MOSuite::multiOmicDataSet>
plot_expr_heatmap(
  moo_counts,
  count_type,
  sub_count_type = NULL,
  sample_metadata = NULL,
  sample_id_colname = NULL,
  feature_id_colname = NULL,
  group_colname = "Group",
  label_colname = NULL,
  samples_to_include = NULL,
  color_values = NULL,
  include_all_genes = FALSE,
  filter_top_genes_by_variance = TRUE,
  top_genes_by_variance_to_include = 500,
  specific_genes_to_include_in_heatmap = "None",
  cluster_genes = TRUE,
  gene_distance_metric = "correlation",
  gene_clustering_method = "average",
  display_gene_dendrograms = TRUE,
  display_gene_names = FALSE,
  center_and_rescale_expression = TRUE,
  cluster_samples = FALSE,
  arrange_sample_columns = TRUE,
  order_by_gene_expression = FALSE,
  gene_to_order_columns = " ",
  gene_expression_order = "low_to_high",
  smpl_distance_metric = "correlation",
  smpl_clustering_method = "average",
  display_smpl_dendrograms = TRUE,
  reorder_dendrogram = FALSE,
  reorder_dendrogram_order = c(),
  display_sample_names = TRUE,
  group_columns = c("Group", "Replicate", "Batch"),
  assign_group_colors = FALSE,
  assign_color_to_sample_groups = c(),
  heatmap_color_scheme = "Default",
  autoscale_heatmap_color = TRUE,
  set_min_heatmap_color = -2,
  set_max_heatmap_color = 2,
  aspect_ratio = "Auto",
  legend_font_size = 10,
  gene_name_font_size = 4,
  sample_name_font_size = 8,
  display_numbers = FALSE,
  plot_filename = "expr_heatmap.png",
  print_plots = options::opt("print_plots"),
  save_plots = options::opt("save_plots"),
  plots_subdir = "heatmap",
  ...
)

## S7 method for class <data.frame>
plot_expr_heatmap(
  moo_counts,
  count_type,
  sub_count_type = NULL,
  sample_metadata = NULL,
  sample_id_colname = NULL,
  feature_id_colname = NULL,
  group_colname = "Group",
  label_colname = NULL,
  samples_to_include = NULL,
  color_values = NULL,
  include_all_genes = FALSE,
  filter_top_genes_by_variance = TRUE,
  top_genes_by_variance_to_include = 500,
  specific_genes_to_include_in_heatmap = "None",
  cluster_genes = TRUE,
  gene_distance_metric = "correlation",
  gene_clustering_method = "average",
  display_gene_dendrograms = TRUE,
  display_gene_names = FALSE,
  center_and_rescale_expression = TRUE,
  cluster_samples = FALSE,
  arrange_sample_columns = TRUE,
  order_by_gene_expression = FALSE,
  gene_to_order_columns = " ",
  gene_expression_order = "low_to_high",
  smpl_distance_metric = "correlation",
  smpl_clustering_method = "average",
  display_smpl_dendrograms = TRUE,
  reorder_dendrogram = FALSE,
  reorder_dendrogram_order = c(),
  display_sample_names = TRUE,
  group_columns = c("Group", "Replicate", "Batch"),
  assign_group_colors = FALSE,
  assign_color_to_sample_groups = c(),
  heatmap_color_scheme = "Default",
  autoscale_heatmap_color = TRUE,
  set_min_heatmap_color = -2,
  set_max_heatmap_color = 2,
  aspect_ratio = "Auto",
  legend_font_size = 10,
  gene_name_font_size = 4,
  sample_name_font_size = 8,
  display_numbers = FALSE,
  plot_filename = "expr_heatmap.png",
  print_plots = options::opt("print_plots"),
  save_plots = options::opt("save_plots"),
  plots_subdir = "heatmap",
  ...
)
Arguments
- moo_counts
counts dataframe or
multiOmicDataSetcontainingcount_type&sub_count_typein the counts slot- count_type
the type of counts to use. Must be a name in the counts slot (
names(moo@counts)).- sub_count_type
used if
count_typeis a list in the counts slot: specify the sub count type within the list. Must be a name innames(moo@counts[[count_type]]).- sample_metadata
sample metadata as a data frame or tibble (only required if
moo_countsis a dataframe)- sample_id_colname
The column from the sample metadata containing the sample names. The names in this column must exactly match the names used as the sample column names of your input Counts Matrix. (Default:
NULL- first column in the sample metadata will be used.)- feature_id_colname
The column from the counts dataa containing the Feature IDs (Usually Gene or Protein ID). This is usually the first column of your input Counts Matrix. Only columns of Text type from your input Counts Matrix will be available to select for this parameter. (Default:
NULL- first column in the counts matrix will be used.)- group_colname
The column from the sample metadata containing the sample group information. This is usually a column showing to which experimental treatments each sample belongs (e.g. WildType, Knockout, Tumor, Normal, Before, After, etc.).
- label_colname
The column from the sample metadata containing the sample labels as you wish them to appear in the plots produced by this template. This can be the same Sample Names Column. However, you may desire different labels to display on your figure (e.g. shorter labels are sometimes preferred on plots). In that case, select the column with your preferred Labels here. The selected column should contain unique names for each sample. (Default:
NULL–sample_id_colnamewill be used.)- samples_to_include
Which samples would you like to include? Usually, you will choose all sample columns, or you could choose to remove certain samples. Samples excluded here will be removed in this step and from further analysis downstream of this step. (Default:
NULL- all sample IDs inmoo@sample_metawill be used.)- color_values
vector of colors as hex values or names recognized by R. Unnamed colors are assigned by factor level order when the grouping column is a factor; otherwise, they are assigned in the order groups first appear in the metadata column. Defaults to
NULL; whenNULL,mosuite_paletteis used fordata.framedispatch and stored colors are used formultiOmicDataSetdispatch.- include_all_genes
Set to TRUE if all genes are to be included. Set to FALSE if you want to filter genes by variance and/or provide a list of specific genes that will appear in the heatmap.
- filter_top_genes_by_variance
Set to TRUE if you want to only include the top genes by variance. Set to FALSE if you do not want to filter genes by variance.
- top_genes_by_variance_to_include
The number of genes to include if filtering genes by variance. This parameter is ignored if "Filter top genes by variance" is set to FALSE.
- specific_genes_to_include_in_heatmap
Enter the gene symbols to be included in the heatmap, with each gene symbol separated with a space from the others. Alternatively, paste in a column of gene names from any spreadsheet application. This parameter is ignored if "Include all genes" is set to TRUE.
- cluster_genes
Choose whether to cluster the rows (genes). If TRUE, rows will have clustering applied. If FALSE, clustering will not be applied to rows.
- gene_distance_metric
Distance metric to be used in clustering genes. (TODO document options)
- gene_clustering_method
Clustering method metric to be used in clustering samples. (TODO document options)
- display_gene_dendrograms
Set to TRUE to show gene dendrograms. Set to FALSE to hide dendrograms.
- display_gene_names
Set to TRUE to display gene names on the right side of the heatmap. Set to FALSE to hide gene names.
- center_and_rescale_expression
Center and rescale expression for each gene across all included samples.
- cluster_samples
Choose whether to cluster the columns (samples). If TRUE, columns will have clustering applied. If FALSE, clustering will not be applied to columns.
- arrange_sample_columns
If TRUE, arranges columns by annotation groups. If FALSE, and "Cluster Samples" is FALSE, samples will appear in the order of input (samples to include)
- order_by_gene_expression
If TRUE, set gene name below and direction for ordering
- gene_to_order_columns
Gene to order columns by expression levels
- gene_expression_order
Choose direction for gene order
- smpl_distance_metric
Distance metric to be used in clustering samples. (TODO document options)
- smpl_clustering_method
Clustering method to be used in clustering samples. (TODO document options)
- display_smpl_dendrograms
Set to TRUE to show sample dendrograms. Set to FALSE to hide dendrogram.
- reorder_dendrogram
If TRUE, set the order of the dendrogram (below)
- reorder_dendrogram_order
Reorder the samples (columns) of the dendrogram by name, e.g. “sample2”,“sample3",“sample1".
- display_sample_names
Set to TRUE if you want sample names to be displayed on the plot. Set to FALSE to hide sample names.
- group_columns
Columns containing the sample groups for annotation tracks
- assign_group_colors
If TRUE, set the groups assigned colors (below)
- assign_color_to_sample_groups
Enter each sample to color in the format: group_name: color This parameter is ignored if "Assign Colors" is set to FALSE.
- heatmap_color_scheme
color scheme (TODO document options)
- autoscale_heatmap_color
Set to TRUE to autoscale the heatmap colors between the maximum and minimum heatmap color parameters. If FALSE, set the heatmap colors between "Set max heatmap color" and "Set min heatmap color" (below).
- set_min_heatmap_color
If Autoscale heatmap color is set to FALSE, set the minimum heatmap z-score value
- set_max_heatmap_color
If Autoscale heatmap color is set to FALSE, set the maximum heatmap z-score value.
- aspect_ratio
Set figure Aspect Ratio. Ratio refers to entire figure including legend. If set to Auto figure size is based on number of rows and columns form counts matrix. default - Auto
- legend_font_size
Set Font size for figure legend. Default is 10.
- gene_name_font_size
Font size for gene names. If you don't want gene labels to show, toggle "Display Gene Names" below to FALSE
- sample_name_font_size
Font size for sample names. If you don't want to display samples names, toggle "Display sample names" (below) to FALSE
- display_numbers
Setting to FALSE (default) will not display numerical value of heat on heatmap. Set to TRUE if you want to see these numbers on the plot.
- plot_filename
plot output filename - only used if save_plots is TRUE
- print_plots
Whether to print plots during analysis (Defaults to
FALSE, overwritable using option 'moo_print_plots' or environment variable 'MOO_PRINT_PLOTS')- save_plots
Whether to save plots to files during analysis (Defaults to
TRUE, overwritable using option 'moo_save_plots' or environment variable 'MOO_SAVE_PLOTS')- plots_subdir
subdirectory in
figures/where plots will be saved ifsave_plotsisTRUE- ...
additional arguments passed to methods
Value
heatmap from ComplexHeatmap::Heatmap()
Details
By default, the top 500 genes by variance are used, as these are generally going to include those genes that most distinguish your samples from one another. You can change this as well as many other parameters about this heatmap if you explore the advanced options.
See also
Other plotters:
plot_corr_heatmap(),
plot_histogram(),
plot_pca(),
plot_read_depth(),
print_or_save_plot()
Other heatmaps:
plot_corr_heatmap()
Other moo methods:
batch_correct_counts(),
clean_raw_counts(),
diff_counts(),
filter_counts(),
filter_diff(),
normalize_counts(),
plot_corr_heatmap(),
plot_histogram(),
plot_pca(),
plot_read_depth(),
run_deseq2(),
set_color_pal()
Examples
# plot expression heatmap for a counts slot in a multiOmicDataset Object
moo <- multiOmicDataSet(
  sample_metadata = as.data.frame(nidap_sample_metadata),
  anno_dat = data.frame(),
  counts_lst = list(
    "raw" = nidap_raw_counts,
    "norm" = list(
      "voom" = as.data.frame(nidap_norm_counts)
    )
  )
)
p <- plot_expr_heatmap(moo, count_type = "norm", sub_count_type = "voom")
#> The total number of genes in heatmap: 500

# customize the plot
plot_expr_heatmap(moo,
  count_type = "norm", sub_count_type = "voom",
  top_genes_by_variance_to_include = 100
)
#> The total number of genes in heatmap: 100


# plot expression heatmap for a counts dataframe
counts_dat <- moo@counts$norm$voom
plot_expr_heatmap(
  counts_dat,
  sample_metadata = nidap_sample_metadata,
  sample_id_colname = "Sample",
  feature_id_colname = "Gene",
  group_colname = "Group",
  label_colname = "Label",
  top_genes_by_variance_to_include = 100
)
#> The total number of genes in heatmap: 100
# plot expression heatmap for a counts dataframe
counts_dat <- moo@counts$norm$voom
plot_expr_heatmap(
counts_dat,
sample_metadata = nidap_sample_metadata,
sample_id_colname = "Sample",
feature_id_colname = "Gene",
group_colname = "Group",
label_colname = "Label",
top_genes_by_variance_to_include = 100
)
#> The total number of genes in heatmap: 100
