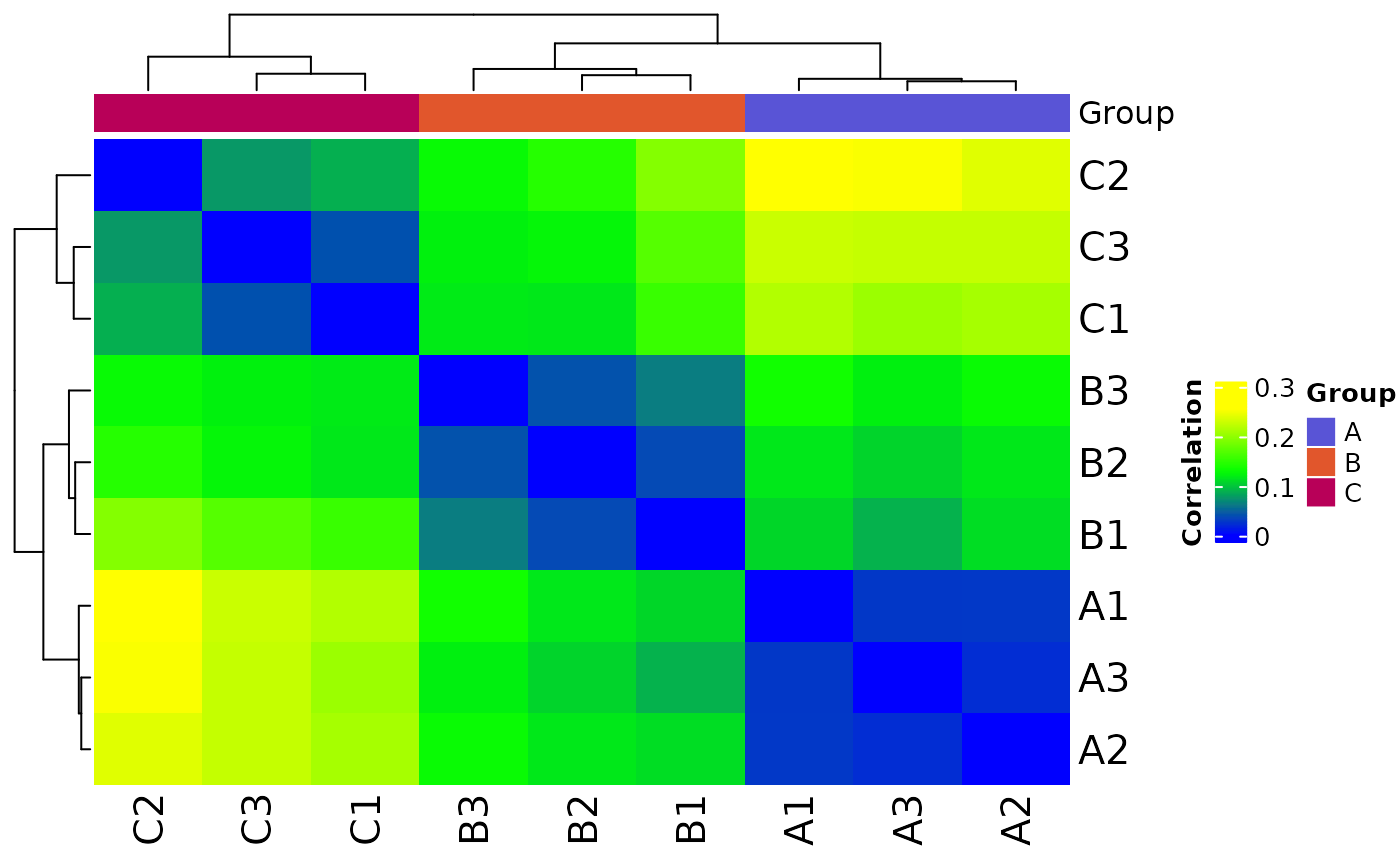
Plot correlation heatmap
Value
heatmap from ComplexHeatmap::Heatmap()
Details
Method Usage
# multiOmicDataSet
plot_corr_heatmap(moo_counts,
  count_type,
  sub_count_type = NULL,
  ...)

# dataframe
plot_corr_heatmap(moo_counts,
  sample_metadata,
  sample_id_colname = NULL,
  feature_id_colname = NULL,
  group_colname = "Group",
  label_colname = "Label",
  color_values = c(
    "#5954d6", "#e1562c", "#b80058", "#00c6f8", "#d163e6", "#00a76c",
    "#ff9287", "#008cf9", "#006e00", "#796880", "#FFA500", "#878500"
  ))
See also
Other plotters:
plot_expr_heatmap(),
plot_histogram(),
plot_pca(),
plot_read_depth(),
print_or_save_plot()
Other heatmaps:
plot_expr_heatmap()
Other moo methods:
batch_correct_counts(),
clean_raw_counts(),
diff_counts(),
filter_counts(),
filter_diff(),
normalize_counts(),
plot_expr_heatmap(),
plot_histogram(),
plot_pca(),
plot_read_depth(),
run_deseq2(),
set_color_pal()
Examples
# plot correlation heatmap for a counts slot in a multiOmicDataset Object
moo <- multiOmicDataSet(
  sample_metadata = as.data.frame(nidap_sample_metadata),
  anno_dat = data.frame(),
  counts_lst = list("raw" = as.data.frame(nidap_raw_counts))
)
p <- plot_corr_heatmap(moo, count_type = "raw")

# plot correlation heatmap for a counts dataframe
plot_corr_heatmap(
  moo@counts$raw,
  sample_metadata = moo@sample_meta,
  sample_id_colname = "Sample",
  feature_id_colname = "Gene",
  group_colname = "Group",
  label_colname = "Label"
)