Plot histogram for multiOmicDataSet
Arguments
- moo_counts
counts dataframe or
multiOmicDataSetcontainingcount_type&sub_count_typein the counts slot- count_type
Required if
moo_countsis amultiOmicDataSet: the type of counts to use – must be a name in the counts slot (moo@counts).- sub_count_type
Used if
moo_countsis amultiOmicDataSetAND ifcount_typeis a list, specify the sub count type within the list- ...
arguments forwarded to method: plot_histogram_dat
See also
plot_histogram generic
Other plotters for multiOmicDataSets:
plot_corr_heatmap_moo,
plot_pca_moo,
plot_read_depth_moo
Examples
# plot histogram for a counts slot in a multiOmicDataset Object
moo <- multiOmicDataSet(
sample_metadata = nidap_sample_metadata,
anno_dat = data.frame(),
counts_lst = list("raw" = nidap_raw_counts)
)
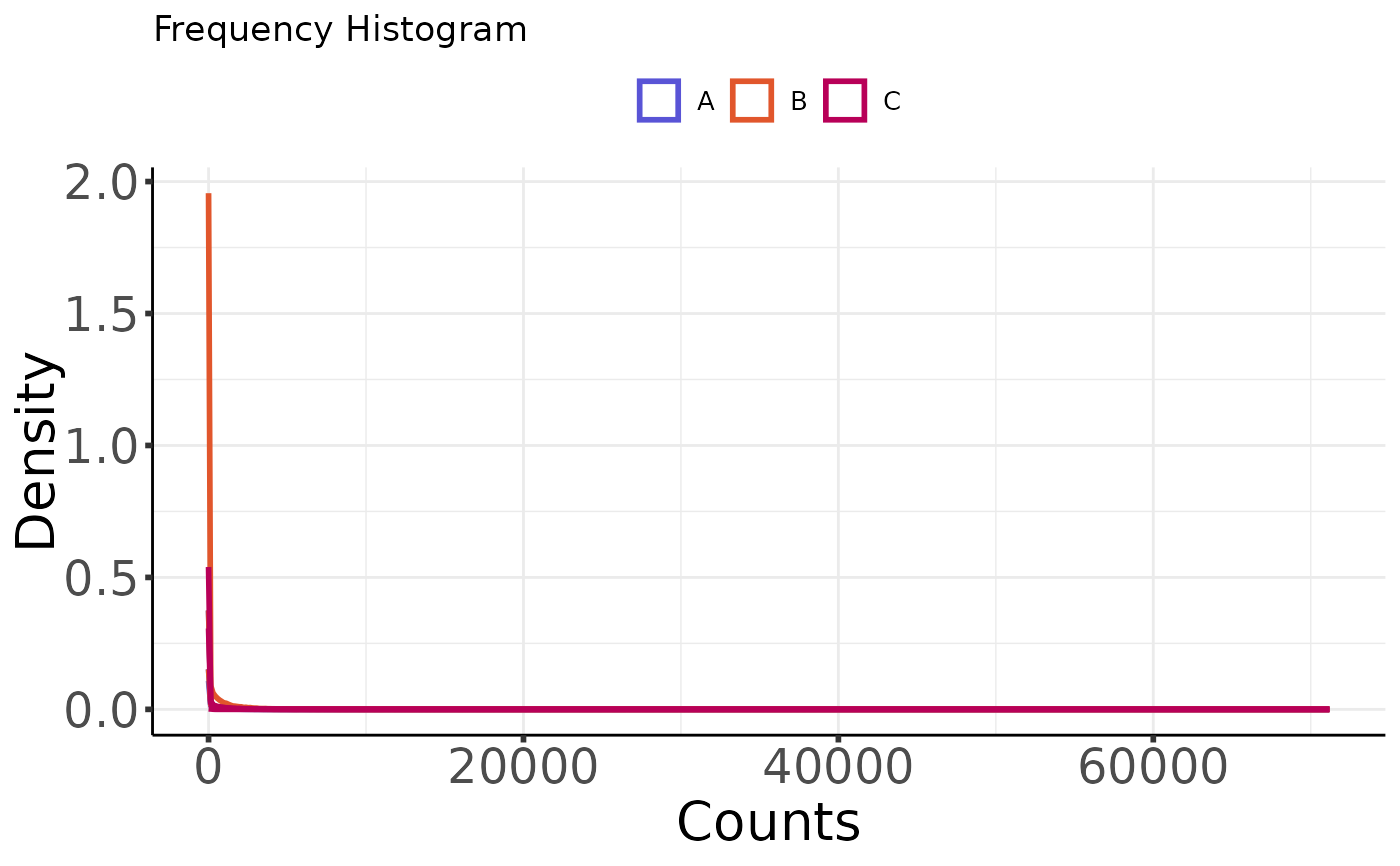
p <- plot_histogram(moo, count_type = "raw")
# customize the plot
plot_histogram(moo,
count_type = "raw",
group_colname = "Group", color_by_group = TRUE
)