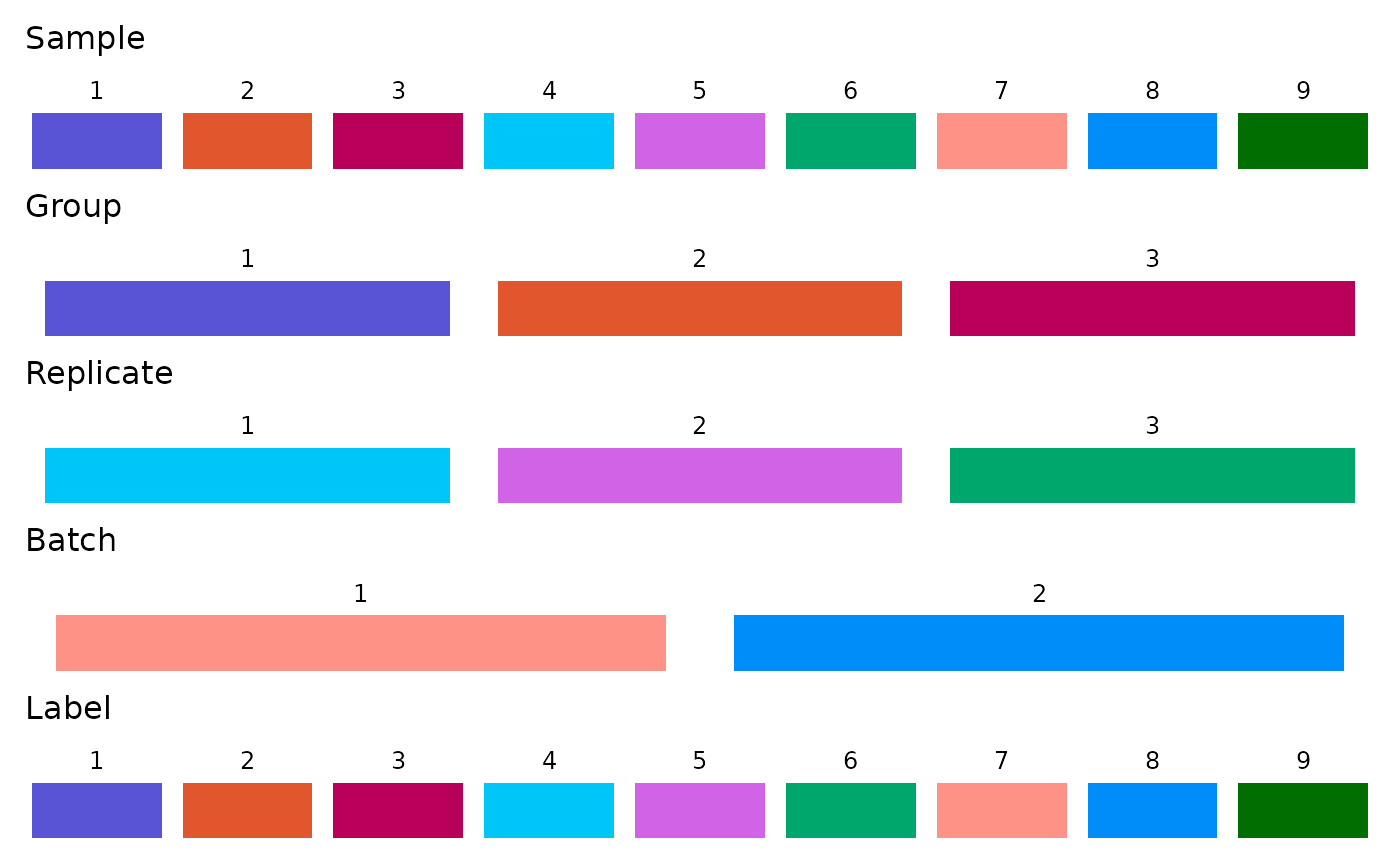
Plots a palette strip for each group column stored in moo@analyses$colors,
stacked vertically. Each strip shows the assigned hex colors and their codes.
Arguments
- moo
A
multiOmicDataSetobject (seecreate_multiOmicDataSet_from_dataframes()).
Value
A patchwork of ggplot2::ggplot objects,
one per group column in moo@analyses$colors.
Examples
moo <- create_multiOmicDataSet_from_dataframes(nidap_sample_metadata, nidap_raw_counts)
display_colors(moo)